Aggregating Container Logs using Elasticsearch, Logbeat and Kibana
Overview
Cluster administrators can aggregate logs and enable application developers to view them for a range of services using the ELK stack ELK stack. The ELK stack can be useful for viewing logs aggregated from hosts and applications distributed using multiple containers.
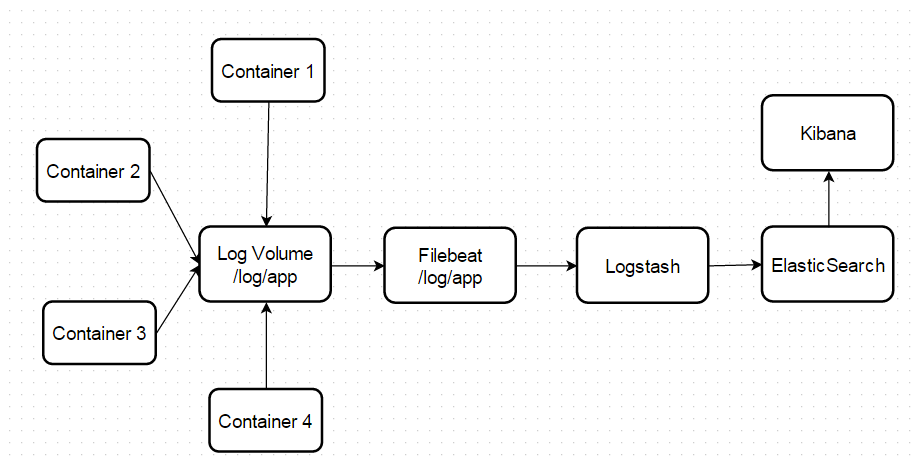
Below components make up the ELK logging stack:
-
Elasticsearch: an object store where all logs are stored.
-
Filebeat: gathers logs from nodes and feeds them to Elasticsearch.
-
Kibana: a web UI for Elasticsearch.
Once deployed on a cluster, the stack aggregates logs from all nodes and projects into Elasticsearch and provides a Kibana UI for users to view logs that they have access to.
Pre-deployment Configuration
Deploying the ELK stack requires:
-
A Remote or Local Docker environment properly configure
-
A clone of github repository
-
Ruby on Rails installed
-
Ruby Gem Rake installed
-
Rake gen installed
-
asciidoctor installed for modification of documentation
-
Install Docker Rack ( gem install docker_rack)
Cloning the Git Repository for ELK Stack
| installation of Docker and Docker Rack is out of scope of this tutorial |
Launching the ELK Cluster
| Make sure that the Docker machine / Host has enough resources to run all the containers |
Building the Docker images
In the kata-elk/baseos directory run:
docker build -t baseos .Validate that the baseos docker image create successfully
$ docker images
REPOSITORY          TAG                 IMAGE ID            CREATED             VIRTUAL SIZE
baseos              latest              1dc121e6f9a4        About an hour ago   468.3 MB
In the kata-elk/filebeat directory run:
docker build -t filebeat .Validate that the filebeat docker image create successfully
$ docker images
REPOSITORY          TAG                 IMAGE ID            CREATED             VIRTUAL SIZE
filebeat            latest              a1c12df7e62d        23 minutes ago      502.9 MB
In the kata-elk/logstash directory run:
docker build -t logsatsh .Validate that the filebeat docker image create successfully
$ docker images
REPOSITORY          TAG                 IMAGE ID            CREATED             VIRTUAL SIZE
logstash            latest              54c53f34852c        15 minutes ago      447.4 MB
logstash            2.1.1               9dc10e4d1616        4 weeks ago         447.4 MB
Starting the docker container for ELK Stack
In the kata-elk/ directory run:
$ \Dev\accordance\microservice-dojo\kata-elk\>docker_rack exec elk:start
Executing 'elk:start'
Starting: /microservice-dojo/kata-elk/container_templates/elasticSearchData.yml
Starting: /Dev/microservice-dojo/kata-elk/container_templates/elasticsearch.yml
Starting: /Dev/microservice-dojo/kata-elk/container_templates/logstash.yml
Starting: /Dev/microservice-dojo/kata-elk/container_templates/kibana.yml
Starting: /Dev/microservice-dojo/kata-elk/container_templates/logData.yml
Starting: /Dev/microservice-dojo/kata-elk/container_templates/fileBeat.yml
Validate that you have all the containers running:
$ docker ps
CONTAINER ID        IMAGE                 NAMES
4e9c404ca604        filebeat              fileBeat
2ce55ad7048d        kibana:4.3.1          kibana
933d50d36182        logstash:2.1.1        logstash
ec9d3f836b4a        elasticsearch:2.1.1   elasticsearch
Launching the Kibana UI
Kibana dashboard: http://dockerhost::5601/
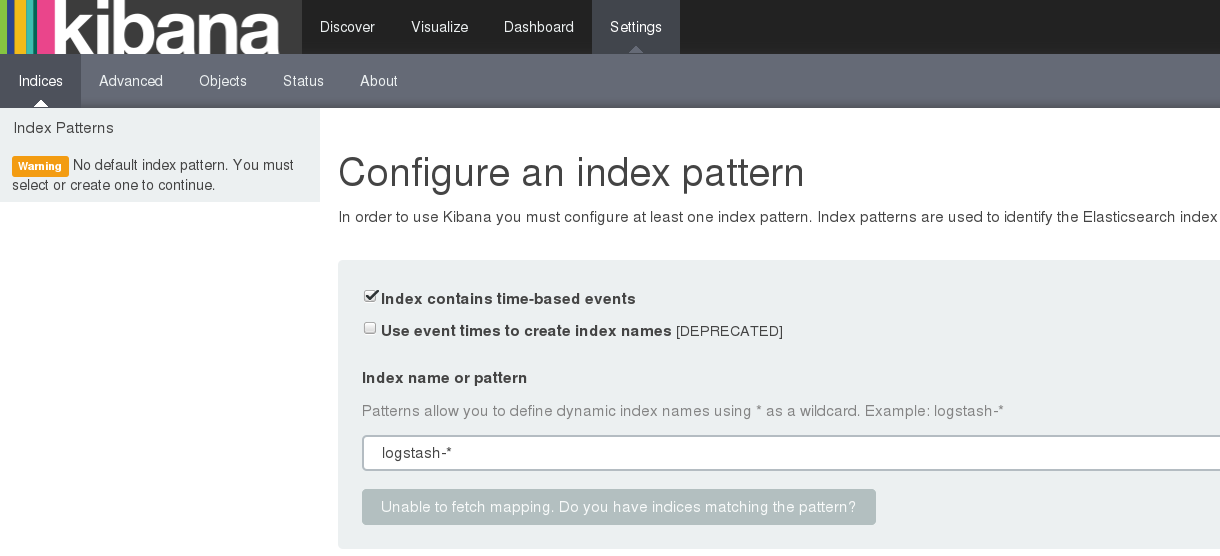
[NOTE] if there are no logs stream to `logstash and elastic search kibana will not be able to fetch the mapping and allow to configure the index.``
Generate some logs
$ docker exec -it fileBeat bash
$ cd log/app
$ vi test.log
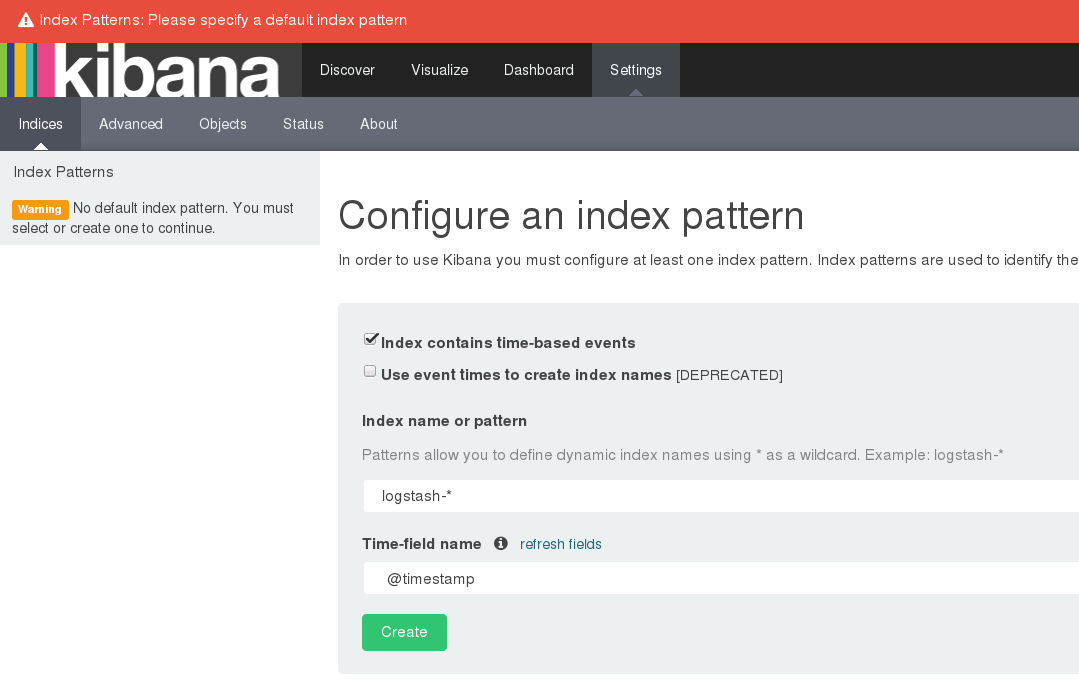
Add some log lines and save the file using !wq commandConfiguring Index pattern to kibana
Navigate to http://dockerhost::5601/
Click on setting → indices as below screen shot and click create
Click on Discover menu and you should be able to see the log lines saved in above steps.